 Mass migration
as a travel business
Mass migration
as a travel business

Statistics for migration across the North Atlantic
(For numbers by shipping line, for numbers by ethnic group, and for 1815-1914 summary totals, scroll down further on this page)
1. Shipping companies bringing steerage passengers
to Ellis Island, 1900-1913.
The 4 largest lines (embark. ports noted), brought (approx.):
North German Lloyd (Bremen, Italy) 1.6 million
Hamburg American (Hamburg, Italy) 1.5 million
Cunard (Liverpool, Hungary) .9 million
Note: These numbers above (and the percentages in the chart below) do not incorporate migrants traveling in second class (c. 15%) or entering the USA from Europe at ports other than New York (c. 30%). See here for statistics which do. These measures also do not include Europeans emigrating to countries other than the USA (about half), or non-Europeans moving to America (roughly 10% of all US immigrants in this period).

Note: The percentage figures shown above are slightly overstated because 28 smaller lines, mostly serving Mediterranean routes, and amounting to about 17% of total steerage arrivals at Ellis Island, were accidentally left off the chart. The corrected percentages for the four largest lines are NGL 17%, Hamburg American 16%, Cunard 10%, and White Star 7%.
Sources: Embarkation ports and steerage passenger flows from Keeling, Business, Voyage Database. Founding years: Keeling, Business, pp. 28, 97.
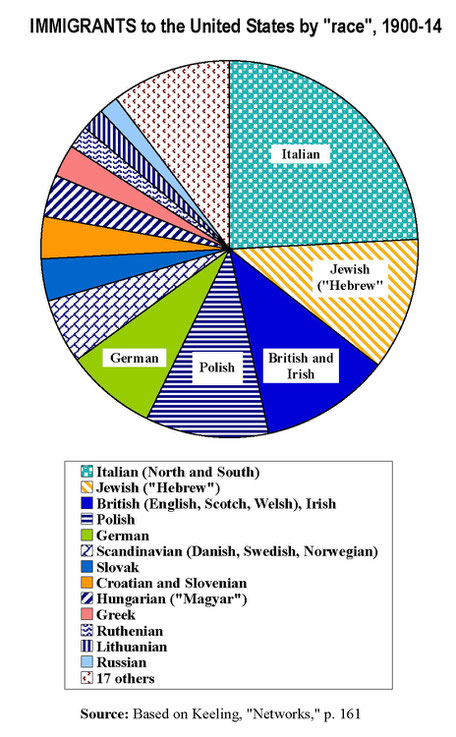
2. U.S. Immigrants by ethnic group ("race"), 1900-14
(Note that "race" in the U.S. Bureau of Immigration classifications was a separate category from national citizenship or origin or resident country. "Germans," for example, included residents of
Austria and Switzerland as well as citizens of the German Empire. "Polish" immigrants came from Germany, Russia and Austria-Hungary. The main criteria for determining race was "native tongue";
this led to some inconsistencies because the designations were made, in the first instance, by clerks or pursers working in diverse locations for many different shipping lines to fill out U.S.
Bureau of Immigration passenger lists.)
3. Summary statistics, US immigration from Europe, 1815-1914
(in millions; "immigration" as defined in US gov't reports)
1815-19 .109
1820-69
6.389
1870-99 10.622
1900-14 12.159
Total, 1815-1914: 29.279
Sources: For 1819-1914, Historical Statistics of the United States,
For 1815-19, Grabbe, p. 93
This page revised and extended 24-November-2024